Help Center
Everything you need to use StockSense, with plain-language explanations of each term.
Quick Start
New to StockSense? Follow these five steps to get your first analysis.
- Register with your email (or Google) and enter the 6-digit code we email you. New accounts get a free 30-day trial.
- Open Watchlists and create a watchlist with up to 5 US stock tickers (for example AAPL, MSFT).
- Go to Sentiment, pick your watchlist and click Analyze to read the latest news for those stocks.
- Return to Home. Each row summarises one stock; click a row for its full report.
- Some data (technical indicators, option skew) fills in automatically within a day. A dash (—) just means “not calculated yet”.
StockSense is a research tool, not financial advice. Always do your own checks before trading.
Home Dashboard
Home shows every stock from all your watchlists in one table. Click a column header to sort, type in the search box to filter, and click a row to open the stock’s report.
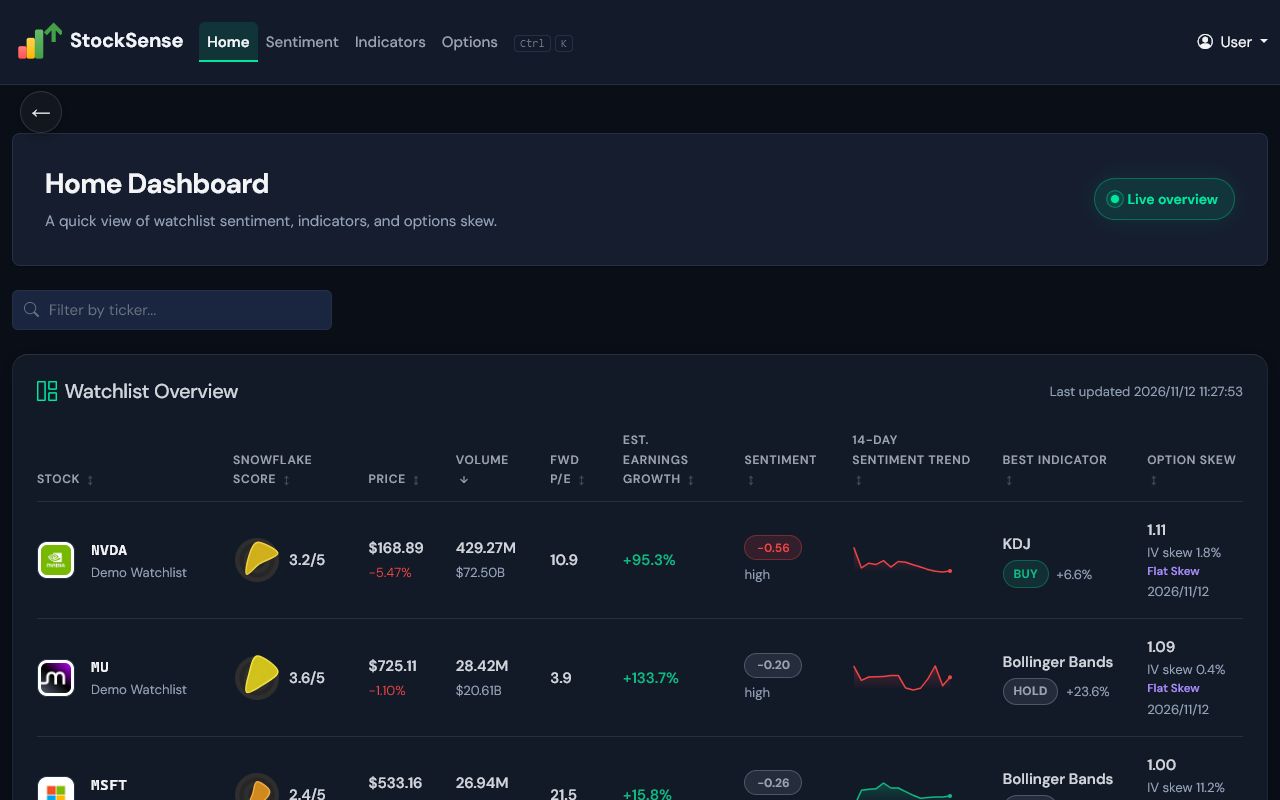
What the columns mean
- Snowflake Score — an overall 0–5 rating built from five checks (see Stock Report below). Higher is better.
- Price / Volume — the latest (slightly delayed) price, today’s % change, and how many shares traded today.
- Fwd P/E (forward price-to-earnings) — share price divided by next year’s expected earnings per share. It tells you how many years of profit you pay for. Lower usually means cheaper; 15–25 is typical for large US companies.
- Est. Earnings Growth — how much analysts expect profit to grow over the next year. +20% means profit is expected to be 20% higher.
- Sentiment / 14-day trend — how positive or negative recent news is, from −1 (very negative) to +1 (very positive). The small line shows how it moved over two weeks. “high/medium/low” is how many articles it is based on.
- Best Indicator — the technical indicator that would have made the most money on this stock over the last ~4 months, its current signal (BUY / HOLD / SELL) and that past return.
- Option Skew — compares put and call option prices. Puts richer (ratio above 1, positive IV skew) means traders are paying for protection against a fall; calls richer means they expect a rise. “Flat” means balanced.
Stock Report & Snowflake Score
Click any stock on Home to open its report: a Snowflake chart, company overview, valuation, sentiment with headlines, best indicator and option skew, each linking to the detailed page.
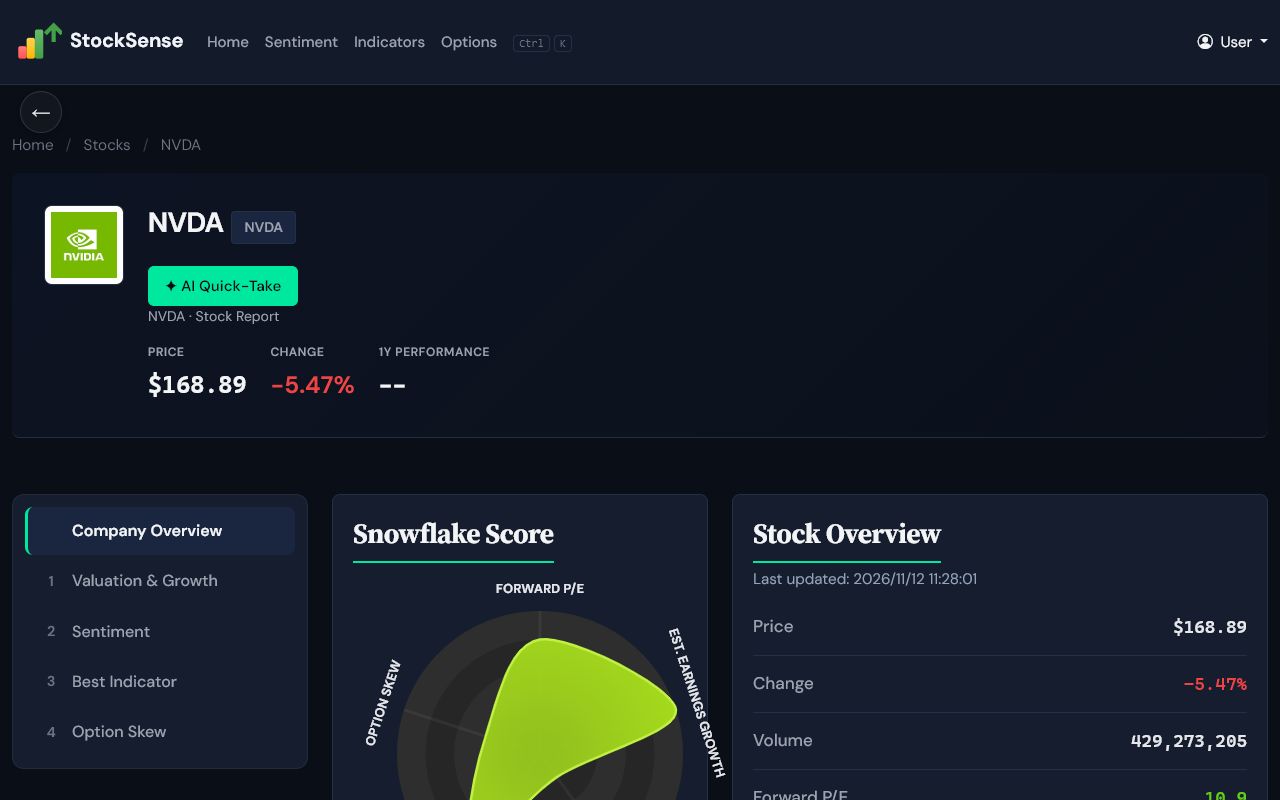
How the Snowflake Score works
Each of the five axes is scored 0 (weak) to 5 (strong); the overall score is their average. An axis with no data is left out.
- Forward P/E — cheaper scores higher: under 10 → 5, 10–20 → 4, 20–30 → 3, 30–40 → 2, 40–50 → 1, 50+ → 0.
- Earnings Growth — faster growth scores higher: 50%+ → 5, 20%+ → 4, 10%+ → 3, 5%+ → 2, 0%+ → 1, shrinking → 0.
- Sentiment — more positive news scores higher: +0.6 or more → 5, down to below −0.6 → 0.
- Best Indicator — the average of the current signal (BUY 5, HOLD 4, SELL 0) and how well that indicator did in testing (40%+ return → 5, losing → 0).
- Option Skew — calls more expensive than puts (traders expect a rise) scores high; puts much more expensive (traders hedging a fall) scores low.
AI Quick-Take
The AI Quick-Take button asks Google Gemini to write a short buy / hold / sell view using the page data plus a live web search: valuation (PEG), news sentiment, upcoming events and the options market.
PEG = forward P/E ÷ expected growth %. Below 1 suggests the price is low for the growth; above 1.5 looks expensive. One report is made per stock per day and shared by all users, so it opens instantly after the first request.
Watchlists
A watchlist is a named group of stocks you want to follow. Every page in StockSense works on the stocks in your watchlists.
- Up to 5 watchlists, each with up to 5 US stock tickers.
- Use the ticker symbol (AAPL), not the company name. Names up to 50 characters.
- New stocks get sentiment and indicator data at the next scheduled update (see FAQ), or immediately if you click Analyze on the Sentiment page.
News Sentiment
Sentiment measures the mood of recent news about a stock. An AI model reads each headline and summary from the last 14 days and scores it from −1 (very negative) to +1 (very positive); the stock’s score is a weighted average, where strongly worded articles count more.
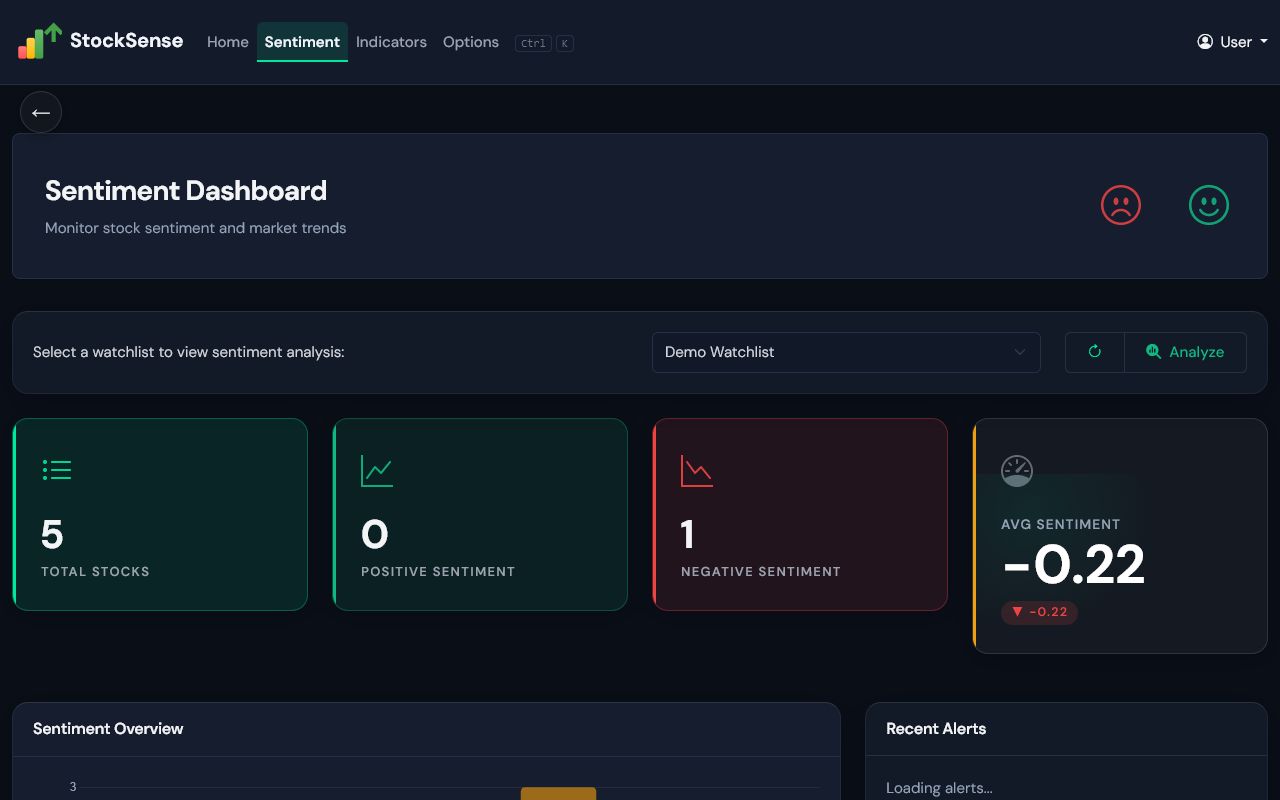
- Buy / Hold / Sell label — above +0.5 is Buy, below −0.5 is Sell, anything between is Hold. A Buy or Sell needs at least 3 recent articles, otherwise it shows Hold.
- Confidence — high = 30+ scored articles, medium = 15+, low = fewer. Low confidence means a few articles can swing the score.
- Analyze button — fetches and scores the newest articles now. It runs in the background and can take a minute or two.
Sentiment reflects news tone, not company value. Good news is often already in the price.
Technical Indicators
Technical indicators are formulas based on past price and volume that traders use to time buying and selling. StockSense tests four popular ones on each of your stocks over the last ~4 months, tries several settings for each, and keeps the settings that worked best.
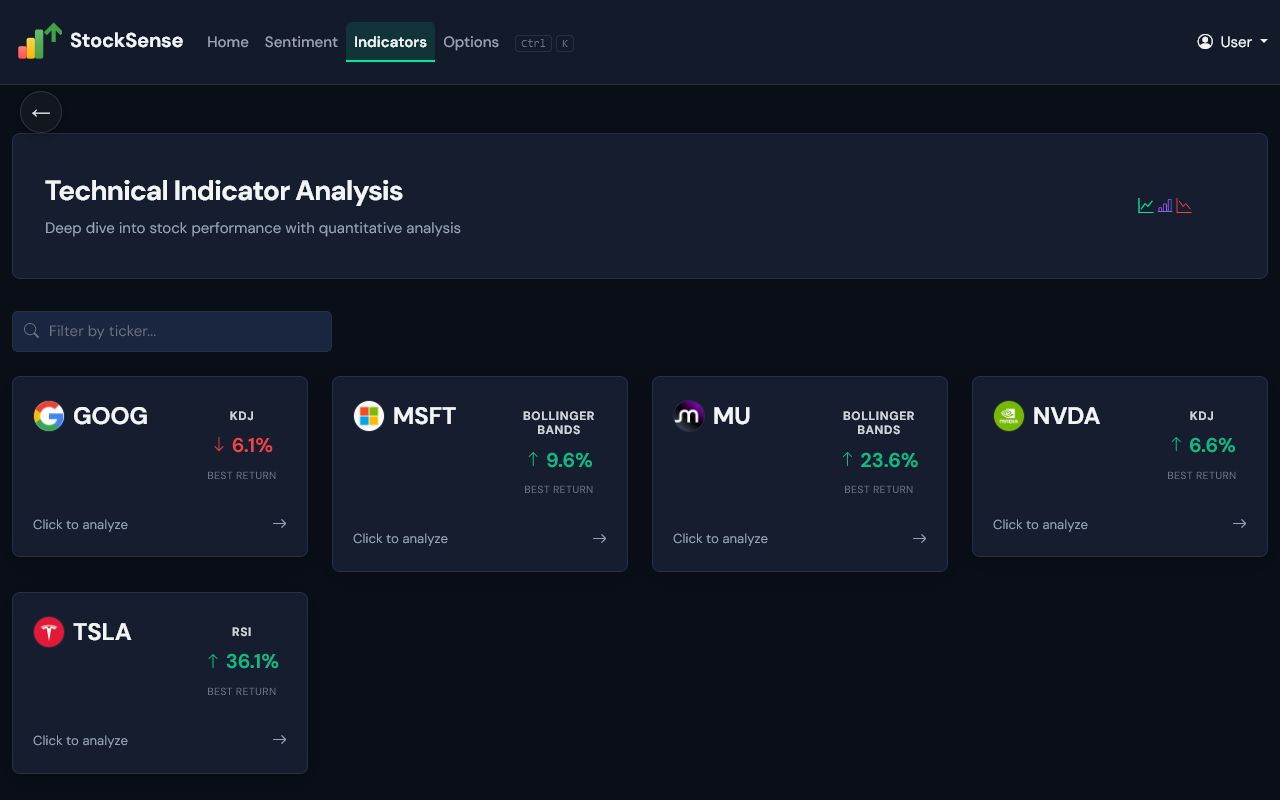
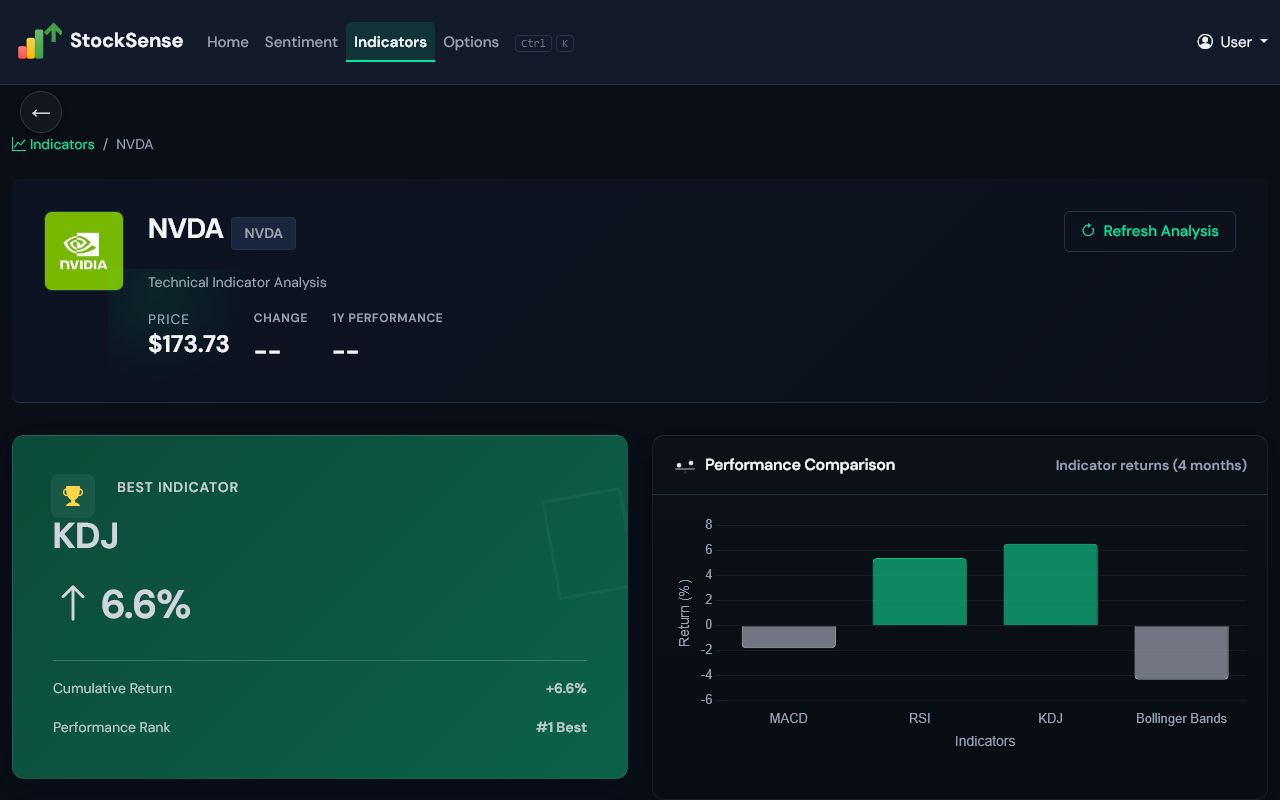
The four indicators
- MACD — compares a fast and a slow moving average of the price. When the fast one crosses above the slow one, momentum is turning up (buy signal); crossing below is a sell signal.
- RSI (Relative Strength Index) — a 0–100 gauge of how fast the price has risen or fallen. Below ~30 is “oversold” (fell too far, may bounce: buy); above ~70 is “overbought” (sell).
- KDJ — similar to RSI; it compares today’s close with the recent high–low range. Its fast J line crossing up gives a buy signal, crossing down a sell signal.
- Bollinger Bands — a band drawn around the average price, wider when the price is jumpy. Touching the lower band is treated as cheap (buy), the upper band as expensive (sell).
Reading the numbers
- Return — how much following that indicator’s signals would have gained or lost over the test period. The indicator with the highest return is marked Best.
- Sharpe ratio — return compared with how bumpy the ride was. Above 1 is good; below 0 means it lost money. Settings within each indicator are chosen by this number.
- Signal — what the indicator says today: BUY, SELL, or HOLD (no new signal).
Results are recalculated every weekday after the US market closes. Past results do not guarantee future returns.
Options Helper
The Options Helper finds options that are attractive to sell for income. It is aimed at strategies like selling cash-secured puts or covered calls, where you collect a payment (the premium) up front.
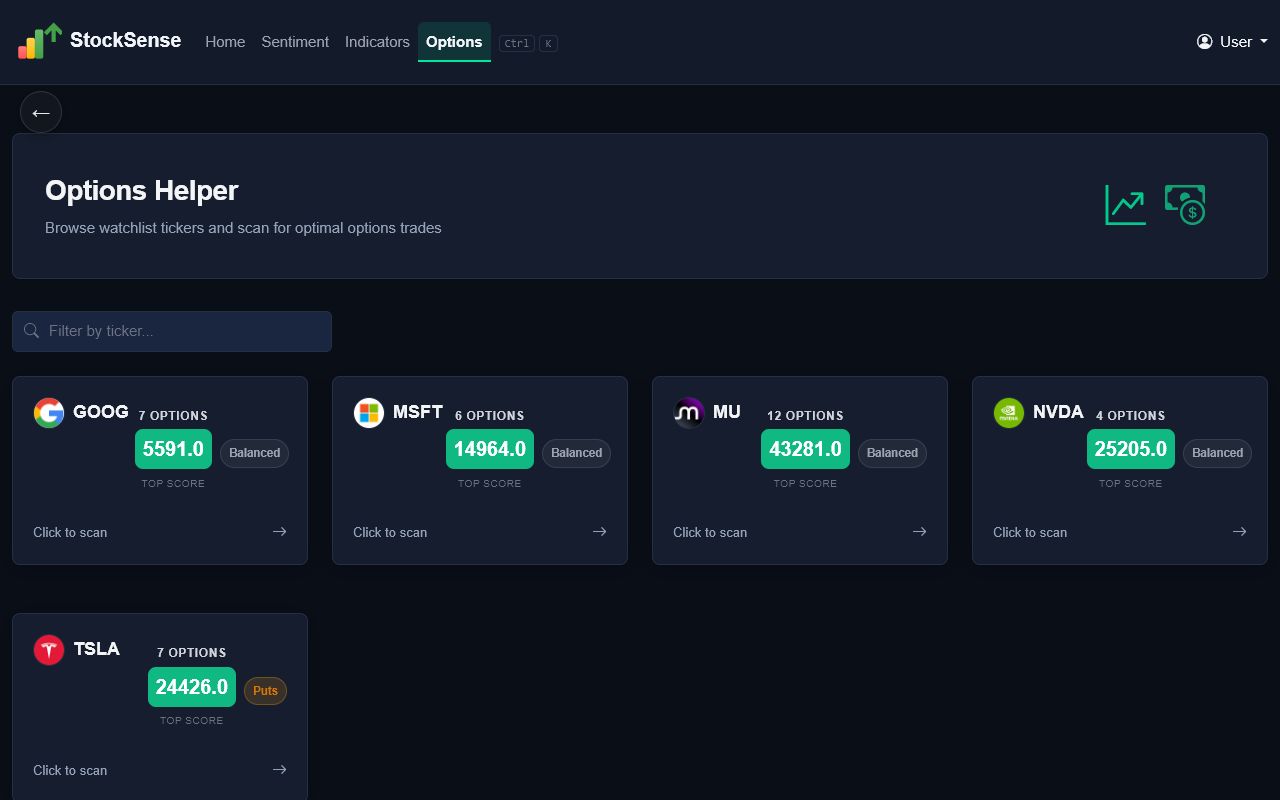
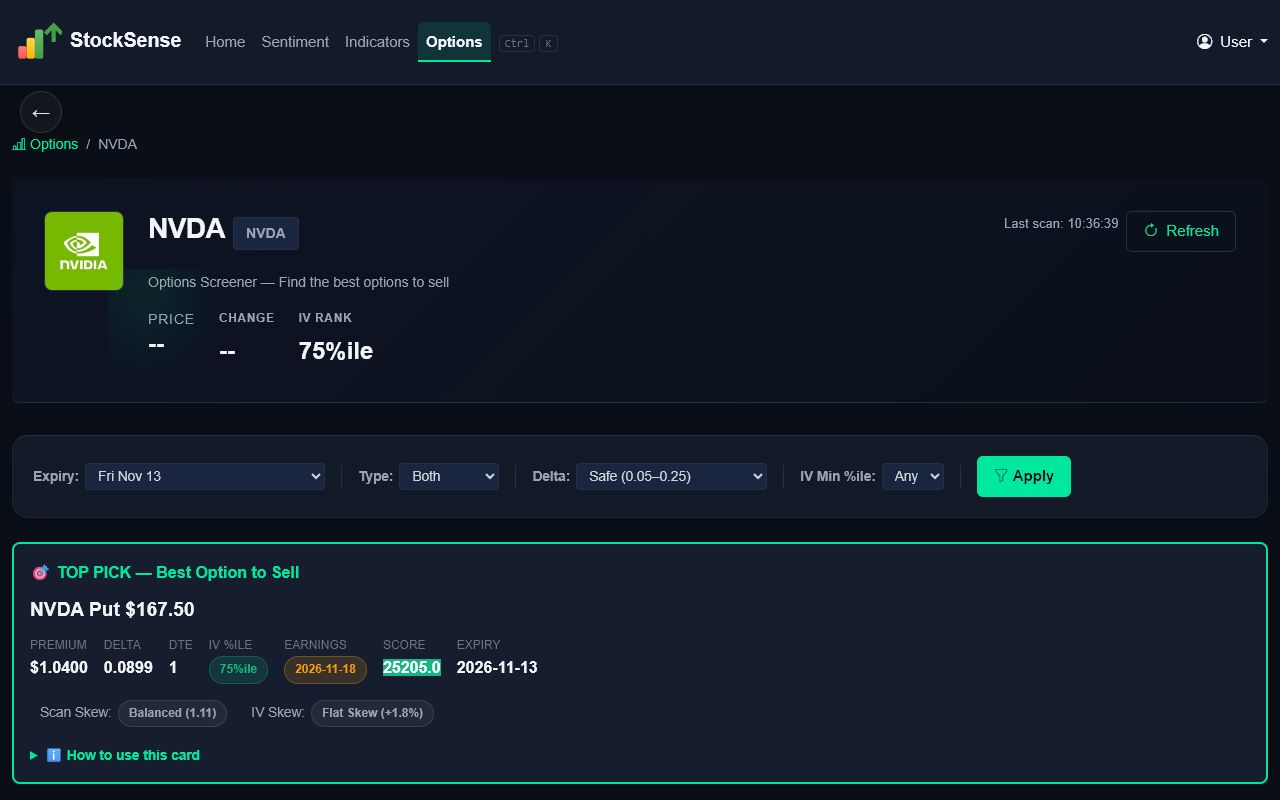
Options basics
- Put / Call — a put gives its buyer the right to sell 100 shares at a set price; a call, the right to buy. When you sell one, you are paid now and may have to buy (put) or sell (call) the shares if the price moves past that level.
- Strike — the agreed price at which the shares change hands.
- Premium — the price of the option, the income you receive for selling it (per share; ×100 per contract).
- Expiry / DTE — the date the option ends; DTE is the number of days to expiry.
- Delta — roughly the chance the option ends “in the money” (you would be assigned). 0.20 ≈ 20%. Lower delta = safer but less premium. The Safe preset uses 0.05–0.25.
- IV and IV percentile — implied volatility is how big a move the market expects; higher IV makes options more expensive. IV percentile ranks today’s IV against the last 30 days: 75 means higher than on 75% of those days, a good time to sell.
- Score — premium as a yearly % of the strike, divided by delta (so it rewards income per unit of risk), ×1000. Use it to compare options against each other; higher is better. The number itself has no fixed scale.
- Earnings warning — company results can move the price sharply. DANGER means earnings fall before the option expires; CAUTION means within 7 days after.
- Scan Skew / IV Skew — whether puts or calls are pricier right now. Selling the pricier side collects more premium.
Selling options can lose much more than the premium received. Make sure you understand assignment before trading.
AI Research Reports
Enter a ticker and choose an AI (Gemini or Grok) and a report type: Comprehensive (business, financials, risks) or Short-term Sentiment (what news and social media are saying now). You can download the finished report.
Limit: 5 new reports per hour. The same request within about 4 hours returns the saved report instantly. AI can make mistakes; check important figures.
Alerts
When the best indicator for one of your stocks gives a new BUY or SELL signal, it appears under the bell icon and in the Sentiment page sidebar. Click an alert to open that stock’s indicator page.
To also get emails, turn on email and indicator alerts in Profile → Notifications. At most 10 alert emails per day, and the same signal is not repeated within 24 hours.
Trial & Subscription
- Every new account gets a free 30-day trial with all features. No card needed.
- StockSense Pro is US$5 per month, paid securely through Stripe.
- When you cancel, you will not be charged again, but Pro features stop working straight away (not at the end of the paid month). You can subscribe again at any time.
Account, Language & App
- Change your name and notification settings on the Profile page.
- Switch language (English, 中文, 日本語) in Settings.
- Forgot or want to change your password? Use “Forgot password” on the sign-in page; we email you a reset link valid for 1 hour.
- Delete your account in Settings by typing DELETE. This removes your profile and watchlists permanently.
- Install as an app: on Android get StockSense from Google Play, or in Chrome/Edge choose “Install app” / “Add to Home screen”.
Demo Mode (no account)
“Try it without an account” lets you explore a fixed demo watchlist: NVDA, MU, TSLA, GOOG and MSFT. You can view Home, stock reports, Sentiment, Indicators, Options and today’s AI Quick-Take if one exists.
Demo mode is read-only: to add your own stocks, run analysis or generate AI reports, register for a free account (30-day trial included).
FAQ & Troubleshooting
- Why do I see “—” instead of a number? — that data has not been calculated yet, usually for a newly added stock. Click the cell to open its page, or wait for the next scheduled update.
- When is data updated? — news sentiment at 10:00 and 14:00 New York time on weekdays; indicators after the market closes each weekday; prices and options during market hours (slightly delayed).
- An options card says it is still scanning. — the first scan of a stock runs in the background. The page updates by itself within a minute or two.
- AI Quick-Take says it is generating, or there is no report. — generation takes up to about 2 minutes; the page checks again automatically. In demo mode a report only exists if a member requested it today.
- A page asks me to subscribe. — your trial has ended or your subscription was cancelled. Subscribe on the Subscription page to restore access.
- Still stuck? — contact us through the Support page linked at the bottom of every page.